Inspiration
I recently stumbled onto the magnificent posters created by Martin Krzywinski over at http://mkweb.bcgsc.ca/pi/. He’s come up with some truly original ways to illustrate the appearance and complexity of various irrational numbers.
Specifically, I really liked the minimalism and simplicity of the 2013 edition, shown here:
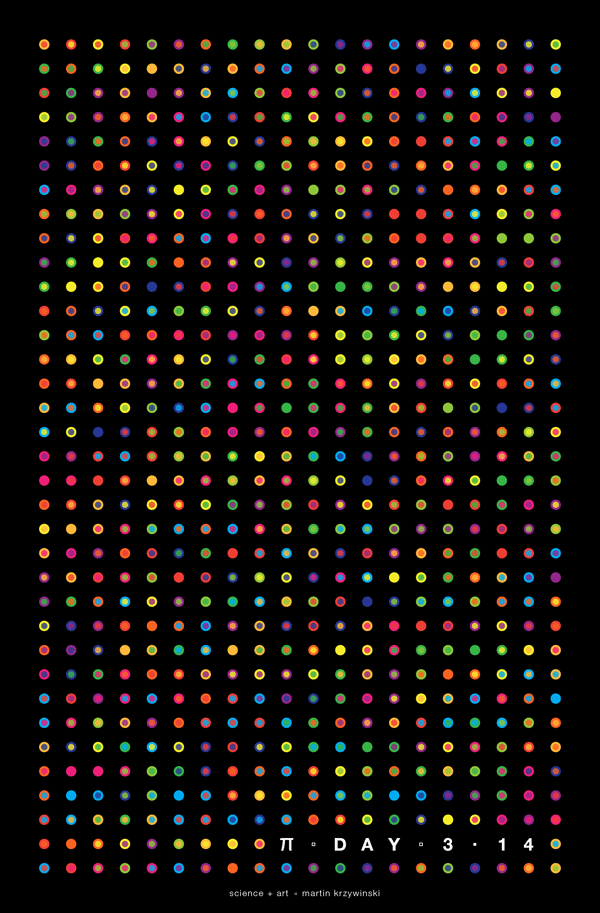
The rules used for generating the coloured dots is fascinatingly simple. Each digit 0-9 is assigned a unique colour. The i’th circle is then coloured according to the value of the i’th digit of Pi. The smaller circle inside is coloured based on the value of the following digit.
Simple rules, complex outcome.
Martin created other versions as well, e.g. one where adjacent equals are connected by same coloured lines. They’re all fascinating and you can even buy them as posters!
Interactive
Looking at these posters I couldn’t help wonder, what lay beyond the chosen boundaries for each poster. What if some great pattern or sequence was lurking just outside of view? If only there was a way to go explore further digits and other constellations using the same visualisation format.
Always the tinkerer, this got me thinking about how to create something like that. One thing led to another and before long I had a rough prototype cobbled together with D3.js.
I spent a bit more time adding a few input controls and polishing it into a neat little demo. I’ve put it up at:
Go try it out! Instructions are at the bottom.
As an example, this is how the Feynman Point looks, at a column width of 31:

For the more curious out there, I’ve put the code on GitHub at github.com/rhardih/winski.
Happy π hunting!