- Part 1: Using a queue
- Part 2: Sorting
- Part 3: The observer pattern
- Part 4: Using Go channels
This post is the first in a series, exploring a random assortment of techniques, data-structures etc. Each of which can be used to solve a puzzle from the 2015 edition of Advent Of Code, namely the first part of Day 7: Some Assembly Required.
In case you’re not familiar with Advent of Code, it is an Advent calendar for programmers of all levels and consists of a series of daily Christmas themed programming challenges. It’s made by Eric Wastl and runs from December 1st until the 24th and usually has an overarching theme and narrative from start to finish.
The puzzles tends to start off on the easier side and then gets progressively harder as the month goes along.
Spoiler alert: I’ve never actually managed to complete all 24 puzzles in time for Christmas in any year. Some of the puzzles are simply too hard for me and in fact, at the time of writing, I’ve only managed to complete an entire calendar a single year – 2017. Now whilst there is a competition aspect to Advent of Code, this seems mostly dominated by people who do competitive programming. For other mere mortals, many use it as an opportunity to get acquainted with a new language for instance. I feel the learning aspect is really the core of Advent of Code rather than the competition.
It’s about the journey, not the destination.
Obviously solutions can be looked up if you get stuck. This post itself is a case in point. Personally though, I prefer to fail a puzzle if I cannot figure it out. Sometimes it takes tumbling a problem around in your head for awhile before you can find a new approach or another place to look for inspiration. By looking up solutions, you might rob yourself of a very rewarding Aha! moment.
The puzzle
The story behind this one, is that we need to help little Bobby Tables assemble an electronics circuit brought to him by Santa.
We are given a series of instructions, each describing a step in how to assemble the circuit using wires and bitwise logic gates. Once assembled, we should be able to answer what signal value a specific wire has if the circuit was live.
Here is the sample circuit provided as an example, along with the expected output on each wire after the circuit has been run:
123 -> x
456 -> y
x AND y -> d
x OR y -> e
x LSHIFT 2 -> f
y RSHIFT 2 -> g
NOT x -> h
NOT y -> i
d: 72
e: 507
f: 492
g: 114
h: 65412
i: 65079
x: 123
y: 456
Input
There’s a few things to note which isn’t apparent from the above sample. The following points are revealed by looking at the real puzzle input instead:
- Ordering of instructions is arbitrary. That means instructions can reference wires, before they’ve been assigned a signal.
- Direct signal assignment can come from both numbers and wires.
- The lefthand side of an AND instruction can be both a number and a wire.
- Wire identifiers are a maximum of two letters.
My version of the full input is available here.
Due to the arbitrary ordering, instructions cannot necessarily be carried out in a top-to-bottom manner. There might be a dependency issue on the propagation of signal values, which has to be resolved beforehand. E.g., and in other words, we cannot carry out an instruction with two wires if they don’t both have a signal.
Why this particular puzzle?
Many puzzles has some sort of trick to them, which makes a quick brute force approach infeasible. Some require knowledge about a single specific type of algorithm or data structure and will be quite hard to solve without. Others, like this one, is inherently more open and can be solved in a number of different ways. It’s primarily up to the preference and experience of the participant.
I quite like that it models a real world thing as well. It’s a programming problem firstly, but you can easily imagine building a circuit in this manner if you had the same base components. Aside from that it also introduces the participant to various computing fundamentals such as a 16-bit architecture, bitwise operations and logic gates. It even has a domain-specific language to define the circuit with!
Queues
Wikipedia obviously has a very in-depth description about queues as a datatype, but this simple illustration should be more than enough to get the idea.
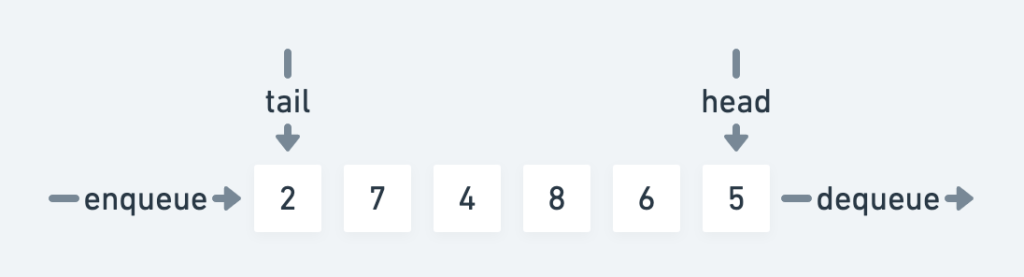
The queue has a front and a back, or head and a tail if you will. It’s a simple collection of elements, in this case numbers, and what makes it different from say a plain list or an array, is that adding and removing elements from the queue happens in an ordered way. The first element added will be the first one to be removed again. This is also known as a first-in-first-out (FIFO) data structure.
Solution
To be honest this approach can probably be considered quick and dirty. It’s not efficient, nor is it particularly elegant. It is, however, not very complicated either.
Outline
Before starting, we need a way to keep track of the overall state of the circuit and for that we use an associative array. It will map the name of a wire to its current signal value.
In short the idea of the solution is to queue up all the instructions first and then continuously try to dequeue and run one. If it’s not possible to carry out an instruction, we put it back on the queue. Rinse and repeat until all instructions are done.
Here’s the details as a stepwise pseudo algorithm:
- Read all instructions into a queue.
- While the queue is not empty:
- Take an instruction off of the queue.
- If the instruction can be performed, i.e. all required signals are present. Carry out the instruction and store the resulting signal value on the target wire.
- If the instruction cannot be performed, push it back onto the queue.
- Print out the value of desired target wire.
Source
Below is a Ruby version of this approach. Whilst Ruby is a really nice language, there’s not really any specific reason for choosing it here, aside from it having an implementation of a Queue as part of the standard library.
Note: Ruby doesn’t have 16-bit numbers natively, and since this problem specifically calls for it, it’s necessary to bound the value of computations.
We carry out 1. on line 5 and then we enter the loop in 2. on line 17. In the loop we use Rubys ability to regex match case statements in order to find the correct instruction. Then for each instruction, we test if it can be carried out by checking if there’s already a stored signal value for the referenced wires. The remainder of the code should be self-explanatory.
Since the input is read directly from stdin, running it can be done like so:
$ ruby 7p1-queue.rb < 7.inRun-time analysis
The solution might be simple, but the tradeoff of just trying instructions until the shoe fits, means that the run-time complexity is quite poor. If we assume being able to carry out and remove, at least one instruction every loop, we wind up iterating as follows:
n + (n - 1) + … + 2 + 1
In other words, the sum from 1 to n. This is an arithmetic progression with the following solution:
n * (n + 1) / 2
If we expand this to n^2/2 + n/2 and get rid of the non-dominant terms this yields a worst case running time of O(n^2).
Inside the loop we could consider the run-time of queue operations, hash lookups and regular expression matches, but I’ll go out on a limb here, and wager, that for this particular program, none of these are more expensive than O(n) in the worst case. That means n^2 is still the dominating term, and so we can accept O(n^2) as the run-time complexity.
Luckily the number of instructions in the input isn’t very long:
$ wc -l 7.in
     339 7.in
In this case, a quadratic run-time is still viable for a fast solution:
$ time ruby 7p1-queue.rb < 7.in
Signal ultimately provided to wire a: 16076

real    0m0.225s
user    0m0.150s
sys     0m0.054s
Memory usage
If we add a bit of memory profiling using the excellent memory_profiler gem, we can see the following allocations:
$ ruby 7p1-queue.rb < 7.in | head -3
Signal ultimately provided to wire a: 16076
Total allocated: 4.61 MB (56660 objects)
Total retained: 28.23 kB (341 objects)
We do load the entire input file into memory, but considering its size:
$ stat -f %z 7.in
5304
Which is just slightly above 5KiB, this should clearly not be the culprit. This is probably just a very memory hungry way to do things.
If we inspect the profiler output further, it’s clear that we’ve paid a dear price for using the syntactic sugar; Regexp#=== pattern for the case statement.
allocated memory by class
-----------------------------------
   3.05 MB  MatchData
   1.53 MB  String
  14.43 kB  Hash
   3.53 kB  Array
   76.00 B  Thread::Queue
   72.00 B  Thread::Mutex
In the next post we’ll take a look at a solution based on sorting, whereby we can avoid the problem caused by arbitrary ordering of instructions. Part 2.